Surface weather maps, part 1
Issue 107 : Mar/Apr 2016
Surface weather maps offer a wealth of information to the weather-savvy mariner. The key to unlocking the information displayed on these maps is understanding the terminology and symbols meteorologists use to portray weather patterns. Let’s start with surface maps, key terminology, meteorological time systems, and barometric pressure.
Two types of surface maps
Surface weather maps come in two varieties: analyses and forecasts. They are similar in appearance but are far from interchangeable. Analyses show recent surface weather observations and features and are published every three hours by NOAA’s Weather Prediction Center (WPC). The observations used to prepare these analyses, such as temperature, dew point, barometric pressure, and wind speed/direction, are collected by thousands of automated weather stations across the country that comprise the Automated Surface Observing System (ASOS).
While analyses display past weather data, surface forecast maps predict weather patterns at a specific time in the future. Interestingly, the same observational data used to create surface analysis maps also serve as the initial input for the computer models that guide the staff of the WPC as they produce their forecasts. No data is wasted at NOAA!
A brief explanation of time
In order to coordinate weather observations and forecasts, the world’s meteorological organizations, including the National Weather Service (NWS), publish their observations and forecasts using time-keeping systems based upon Greenwich Mean Time (GMT), a 24-hour clock system based on the local time on the prime meridian, which is located in Greenwich, England. For example, 1 a.m. in Greenwich is 0100 GMT, noon is 1200 GMT, and 5 p.m. is 1700 GMT.
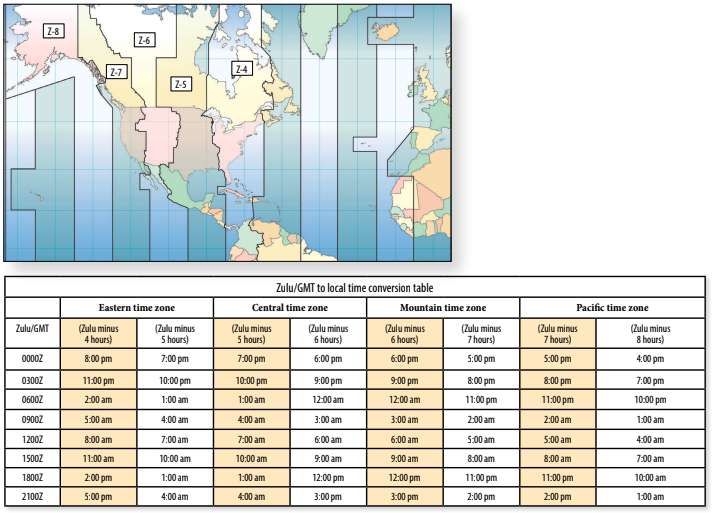
The NWS’s version of GMT is Zulu, abbreviated as “Z” on its maps. In order to apply NWS forecast graphics to your area, you’ll need to convert from Zulu to your local time. The conversion is easy once you know the time difference (time zone offset) between your location and Greenwich. (See the chart on page 15.) When daylight saving time is in effect, if you sail in the Eastern time zone, subtract four hours from Zulu to arrive at your local time. Pacific time zone sailors must subtract seven hours. For example, 1200Z is 8 a.m. Eastern and 5 a.m. Pacific time. During the winter months when daylight saving time is not in effect, subtract an additional hour to convert to local time (1200Z is 7 a.m. Eastern). Refer to the table for Zulu to local time conversions for the four time zones in the continental United States.
Issued and valid: what’s the difference?
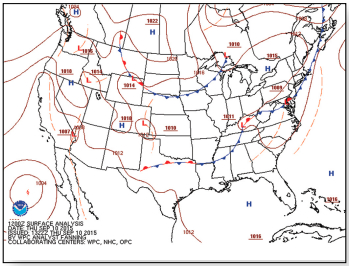
The analyses and forecasts produced by the NWS contain the date and time the map was “issued,” or published. In addition to the issued information, NWS maps contain the “valid” date and time. For a surface analysis, valid indicates the date and time the observations were collected by the ASOS network. For example, the surface analysis (at upper left) was issued at 1322Z on Thursday, September 10, 2015, and displayed observations gathered at 1200Z on the same day.
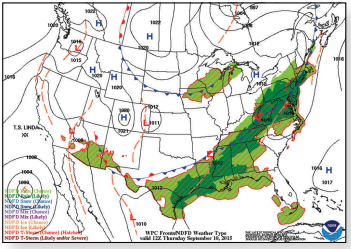
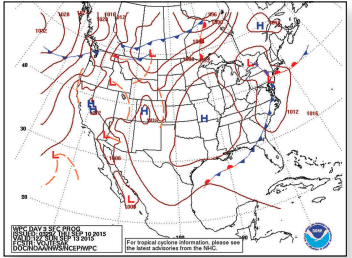
Forecast maps display the predicted state of the atmosphere (barometric pressure, frontal boundaries, precipitation, and so on) at a specific date and time in the future. This future date and time is when the forecast is considered valid. For example, the WPC surface forecast shown in the surface forecast map (at left) was valid at 12Z on Thursday, September 10, 2015. The longer-range forecasts issued by the WPC, such as the Day 3 map (above), contain both the issued and valid times to remind users that it is a forecast for 72 hours into the future.
Barometric pressure
While our focus has been on surface weather patterns, the dynamics that produce weather occur within a deep layer of our atmosphere called the troposphere. The overall height of the troposphere varies by latitude, but on average it reaches approximately six miles above the Earth’s surface. The weight of the air molecules within this layer exert a force on the surface that we know as barometric pressure. A 1-inch by 1-inch column of air extending from the Earth’s surface to the top of the troposphere weighs nearly 15 pounds.
Barometric pressure observations are plotted on surface maps to help meteorologists identify highs, lows, and their associated features such as cold fronts, warm fronts, troughs, and ridges. Barometric pressure patterns plotted on NWS surface maps are adjusted to sea level.
Since barometric pressure is the weight of the air molecules above a particular location, the altitude of the weather station has a dramatic effect on barometric pressure observations. Imagine the perpetual low-pressure system that would exist near Denver simply because the thickness of the troposphere is nearly 5,000 feet less due to the city’s lofty altitude. Adjusting pressure observations based upon the altitude of the station eliminates this awkward situation and makes surface weather maps much easier to interpret.
Looking ahead
In part 2, in the May issue, we’ll examine the symbols and meteorological shorthand used on surface weather maps.
Mark Thornton has been sailing on the Great Lakes for more than 20 years and currently owns Osprey, a C&C 35. His company, LakeErieWX, provides marine weather education seminars, case studies, and forecasting resources to recreational boaters. His website is located at www.LakeErieWX.com.
Thank you to Sailrite Enterprises, Inc., for providing free access to back issues of Good Old Boat through intellectual property rights. Sailrite.com