Surface weather maps, part 2
Issue 108: May/June 2016
In the March 2016 issue I introduced surface weather maps, meteorological time-keeping systems, the difference between issued and valid date and time, and barometric pressure. Now we’ll look at the symbols and meteorological shorthand used on surface weather maps.
Pressure patterns
The solid black lines winding across a surface weather map are isobars — contours of constant sea-level barometric pressure in millibars (mb). Isobars are typically drawn at 4-millibar intervals and are labeled near the image border. One 1020-mb isobar in the illustration on the facing page starts in the Gulf of Mexico and crosses the Florida Panhandle before running north along the East Coast. At any point along this isobar, sea-level pressure is expected to be 1020 mb. Isobars allow forecasters to understand overall pressure patterns and identify areas of low and high pressure, along with other surface features.
Highs and lows
Areas of high and low pressure, each marked by a blue H or a red L, are easy to spot. Near each H and L is a label indicating its sea-level pressure. For example, the low off the coast of Virginia is 1012 mb, while the high centered over eastern Kentucky is 1024 mb. The average annual sea-level pressure across the U.S. is approximately 1013 mb. However, the threshold separating high and low pressure is not a fixed value but depends on the prevailing weather pattern. Sometimes, a pressure reading of 1010 mb, for example, is considered to be high pressure relative to the overall pattern. At other times it is low pressure.
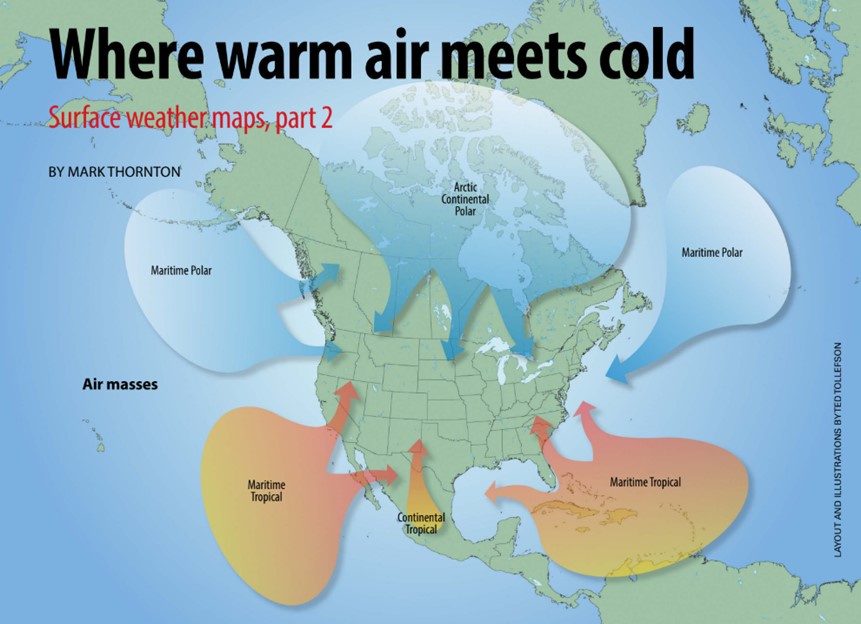
Air masses
Many of the symbols on surface weather maps identify boundaries, or fronts, between air masses. An air mass is a body of air extending across a large area (hundreds of square miles or more) and is nearly uniform with respect to temperature and moisture. The nature of an air mass is influenced by the region in which it originates. For example, an air mass surging south from Canada is typically cooler and drier than an air mass moving north from the Gulf of Mexico. The boundaries where these air masses meet are important to weather forecasting because they’re often associated with rapid changes in temperature, abrupt wind shifts, precipitation, and thunderstorms. In other words, weather “events” occur near frontal boundaries.

Fronts
Frontal boundaries (or fronts) are associated with lows. However, not all lows have fronts, particularly small-scale lows that form in response to local conditions. While lows may or may not have frontal boundaries, highs never have fronts.
The designation of a boundary as a stationary, cold, or warm front is determined by the movement of the colder air mass. Warmer air always yields to the flow of a denser cold air mass. A boundary between a cold and a warm air mass that’s moving at 5 knots or less is called a stationary front (2 on the key to the map above) and is drawn as alternating blue triangles and red half-circles on opposite sides of the line.
A cold front marks the boundary between colder and warmer air when the colder air is advancing toward the warmer air (3 on the map key). Cold fronts typically extend from a low and are drawn as a blue line with blue triangles. The blue triangles are placed on the warm side of the boundary and indicate the direction the front is moving. On average, cold fronts move forward at about 20 knots.
When the cold air along a boundary is retreating instead of advancing, the boundary is identified as a warm front (1 on the map key). Warm fronts are drawn as a red line with red half circles that appear on the cold side of the line and show the direction the front is moving. The nature of warm fronts results in an average forward speed of 10 knots — about half the speed of cold fronts.
As a low-pressure system matures, its faster-moving cold front often overtakes the warm front. This boundary is an occluded front (5 on the map key) and appears as a series of alternating purple triangles and half circles along a purple line. An occluded front marks the boundary between the advancing cold air behind the cold front and retreating cold air ahead of the warm front. The triangles and half circles signal the direction the front is moving.
Although often included in descriptions of surface boundaries, troughs, shown as a yellow dashed line (4 on the map key) are not boundaries between air masses. They are elongated areas of low pressure within an air mass. (A lengthy trough extends from Texas to North Dakota on the surface map illustration above.) Although troughs don’t usually produce severe weather or dramatic temperature changes, their passage often results in significant wind shifts.
Blowing warm and cold
Since the type of the front is determined by whether the colder air mass is advancing or retreating, fronts can easily change from one type to another. For example, if an advancing cold air mass stalls and then retreats, the boundary transitions from a cold front to a stationary front and then to a warm front. It’s part of what makes weather forecasting interesting.
Mark Thornton has been sailing on the Great Lakes for more than 20 years and currently owns Osprey, a C&C 35. His company, LakeErieWX, provides marine weather education seminars, case studies, and forecasting resources to recreational boaters. Learn more at his website: www.LakeErieWX.com.
Thank you to Sailrite Enterprises, Inc., for providing free access to back issues of Good Old Boat through intellectual property rights. Sailrite.com