Revealing storm structure through scanning strategies
Issue 111: Nov/Dec 2016
In the first part of this two-part series (in the September 2016 issue), Mark explained the basics of Doppler weather radar and described the most common image types created from the data. In this second part, he looks at the behavior of radar beams and radar anomalies, and offers a few guidelines for using radar imagery to help visualize the dynamics and movements of weather systems.
Every National Weather Service radar station has two operational modes — clear-air and precipitation. While in clear-air mode, the station’s antenna rotates more slowly than in precipitation mode. This increases the station’s ability to detect small targets or targets that reflect radar pulses poorly, such as snow. Precipitation mode, as the name suggests, is used when larger or more reflective targets, such as raindrops, are present. The radar image will usually indicate which operational mode is in use.
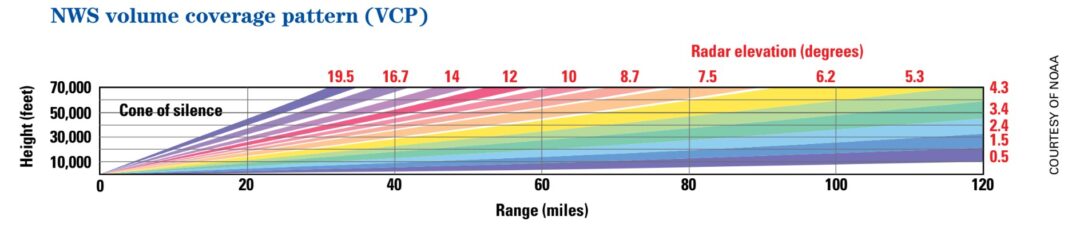
Intense thunderstorms may reach altitudes as high as 50,000 feet. To assess their overall structure, the station employs several scanning strategies, called volume coverage patterns (VCP), to collect data from the surface to the upper reaches of the atmosphere. The antenna conducts an initial, or base, scan by making one complete revolution at an elevation of 0.5° above the Earth’s surface, alternating between emitting and collecting backscattered pulses. When this base scan is complete, the antenna completes additional scans, repeatedly increasing the antenna’s elevation by about one degree until the highest elevation of the VCP is reached. The highest elevation scanned by NWS radar is 19.5°. As a result, the region directly above the radar station isn’t scanned and is referred to as the “cone of silence.” The collection of individual scans within a VCP is known as a volume scan.
Radar images are not live
Transmitting pulses, gathering backscattered energy, and processing the data from a volume scan takes time. The process takes about 10 minutes in the slower clear-air mode and from 4 to 6 minutes in precipitation mode. As a result, a radar image may be anywhere from a few seconds to 10 minutes old. Fast-moving thunderstorms can travel 6 miles or more between updates, so an approaching storm might be much closer than it appears on the most recent radar image. It’s important, when viewing radar images, to ascertain the age of an image by looking at the time stamp.
Beam behavior
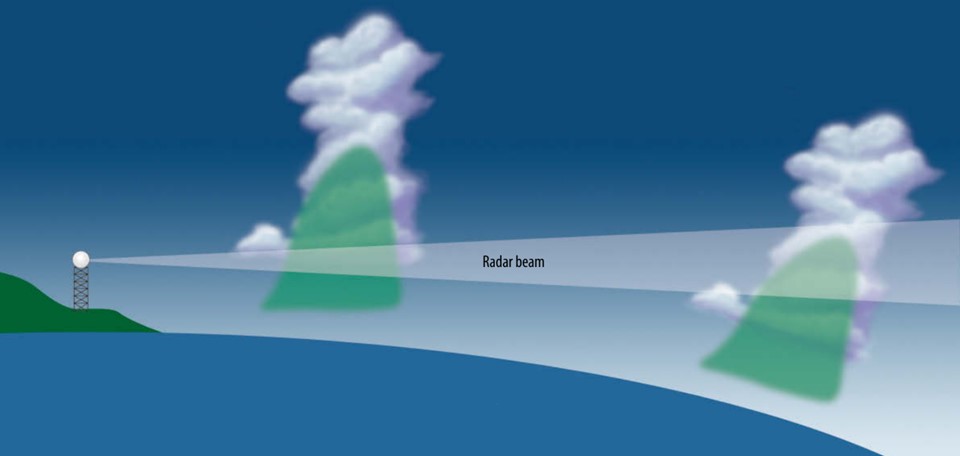
Due to Earth’s curvature, the altitude of a radar beam is greater the farther it radiates from the station — at 120 miles it’s near 10,000 feet. Beam width also increases with distance (similar to a flashlight beam) at the rate of 1,000 feet for every 10 miles. In addition, pulses that are reflected or absorbed by targets closer to the station reduce the number of pulses available to sample distant storms. Combined, these beam behaviors progressively diminish the station’s ability to effectively scan and resolve thunderstorm features at greater distances. Due to the height of the beam and reduced resolution, distant storms may, therefore, appear less threatening than they actually are.
The best strategy for coping with the troublesome effects of beam behavior is to view the image created by the station closest to the storm you are monitoring. To do this when using a radar app on a device that’s equipped for geolocation, such as a cellphone, you might have to override the app’s default selection, which is usually the station closest to your location.
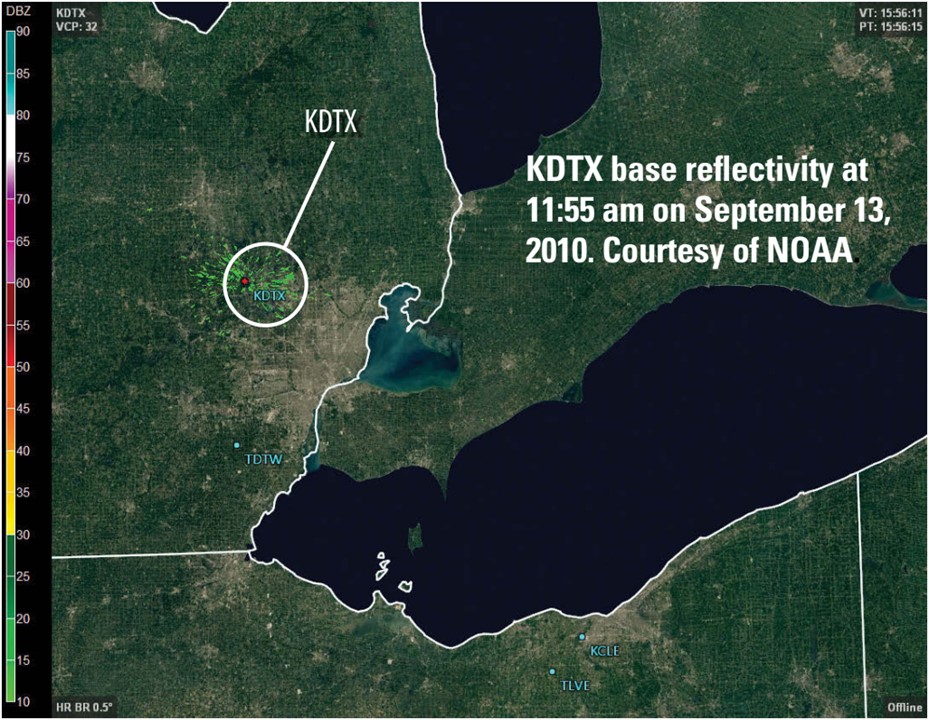
False storms
Not everything that looks like precipitation on radar is actually precipitation. As it passes through the atmosphere, a radar beam can be deflected from its intended path by layers of the atmosphere with different temperature and moisture characteristics. Occasionally, the beam can be abruptly bent toward the ground, an occurrence known as anomalous propagation (AP). When AP occurs, the ground (or the surface of a body of water) becomes the target and results in a strong return of radar pulses. The station, unaware that the beam has been deflected, interprets the strong returns as distant storms.
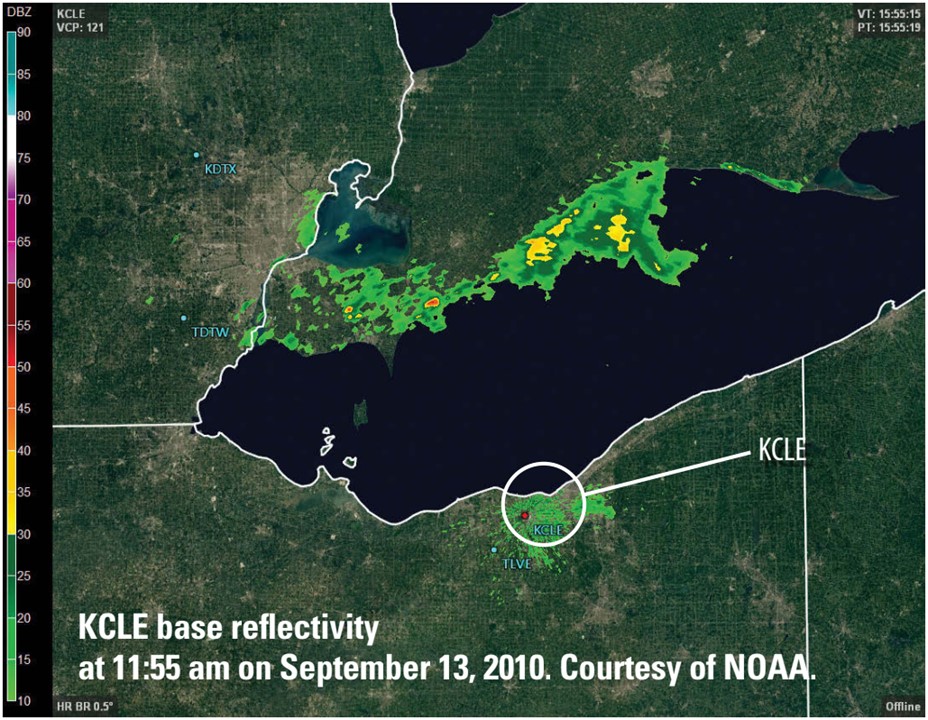
Although they appear quite real, the storms and precipitation in southern Ontario on the Cleveland (KCLE) radar image on September 13, 2010, (upper image at right) are the result of AP. Separating fact from fiction is relatively straightforward. Thunderstorms are rarely stationary. Reviewing a loop of reflectivity will reveal if the areas of highest backscattered energy, measured in dBZ, are moving. The view from an adjoining station can also help. In this instance, the activity over southern Ontario was absent from the Detroit (KDTX) imagery (lower image). Satellite imagery is not subject to AP and can be used to check suspicious storms.
Flocks of migrating birds, insect swarms, and bats can also create the impression that precipitation is occurring. The rotating blades of wind turbines often appear as persistent “storms.”
Viewing weather-radar images
Many websites and applications provide access to radar imagery. Regardless of the platform, you are viewing NWS data because the agency operates the only national radar network. For a modest charge, some vendors offer premium services that add overlays of lightning strikes, radar-derived storm tracks, and the boundaries of NWS severe-weather watches and warnings. Premium services are well worth paying for if your goal is to avoid thunderstorms.
Mark Thornton has been sailing on the Great Lakes for more than 20 years and currently owns Osprey, a C&C 35. His company, LakeErieWX, focuses on providing marine weather education seminars, case studies, and forecasting resources to recreational boaters. See his website at www.LakeErieWX.com.
Thank you to Sailrite Enterprises, Inc., for providing free access to back issues of Good Old Boat through intellectual property rights. Sailrite.com